Lecture 01: Introduction
1/24/23
Why statistics?

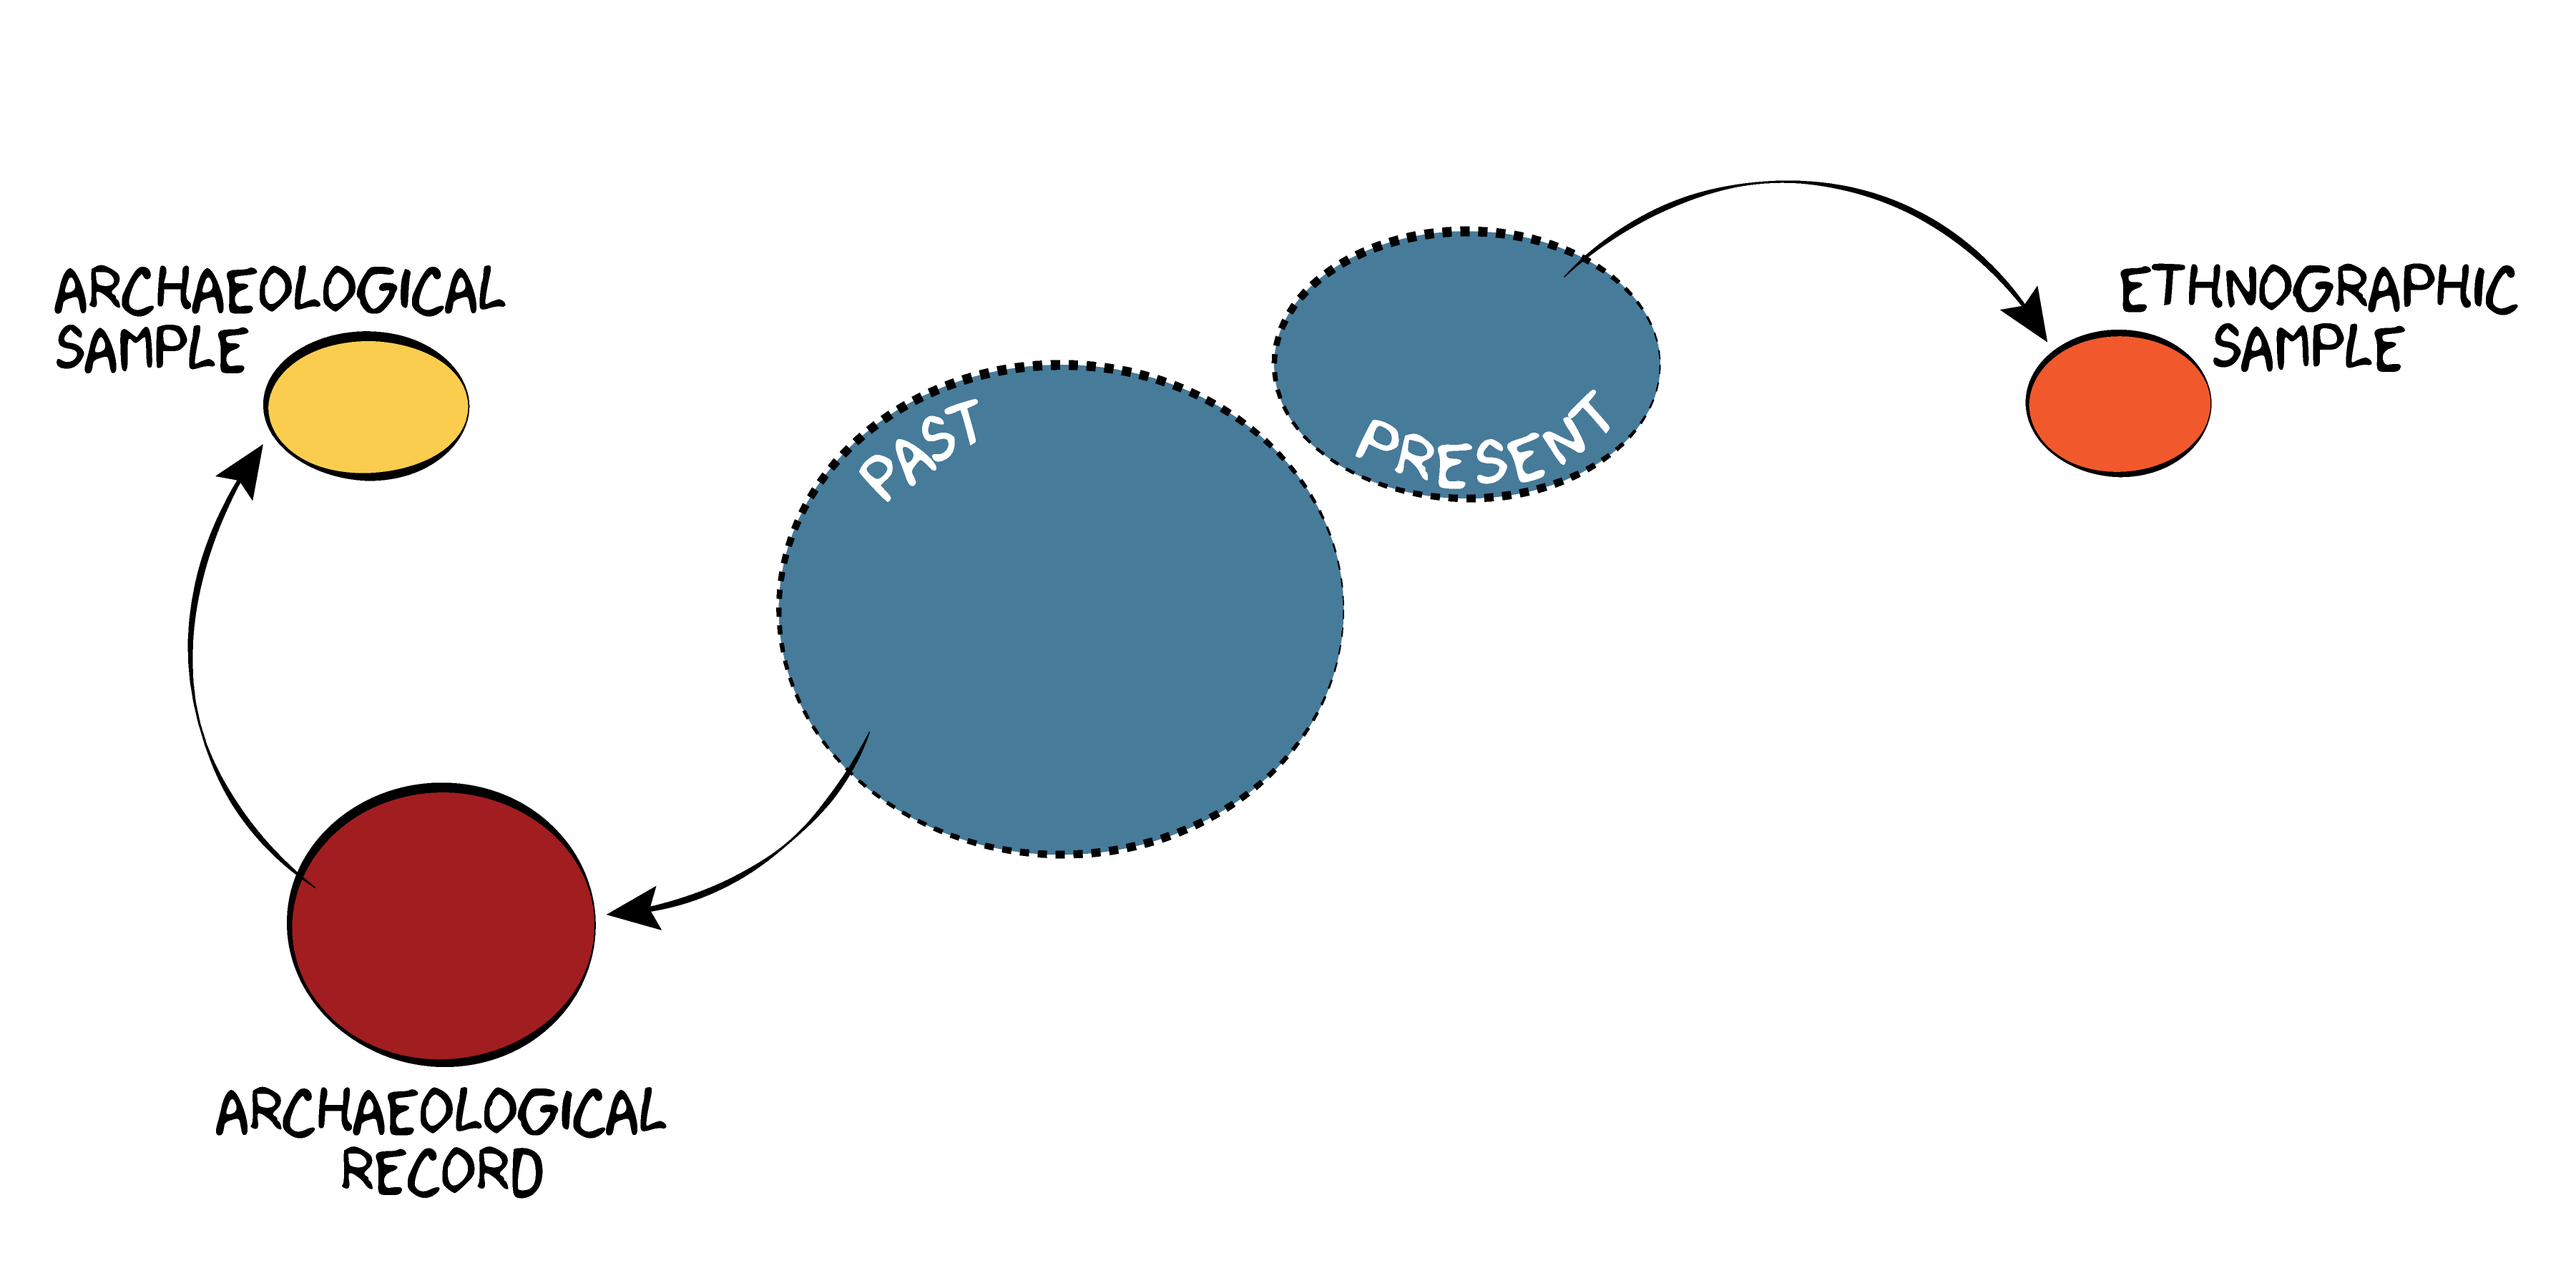
We want to understand something about a population.
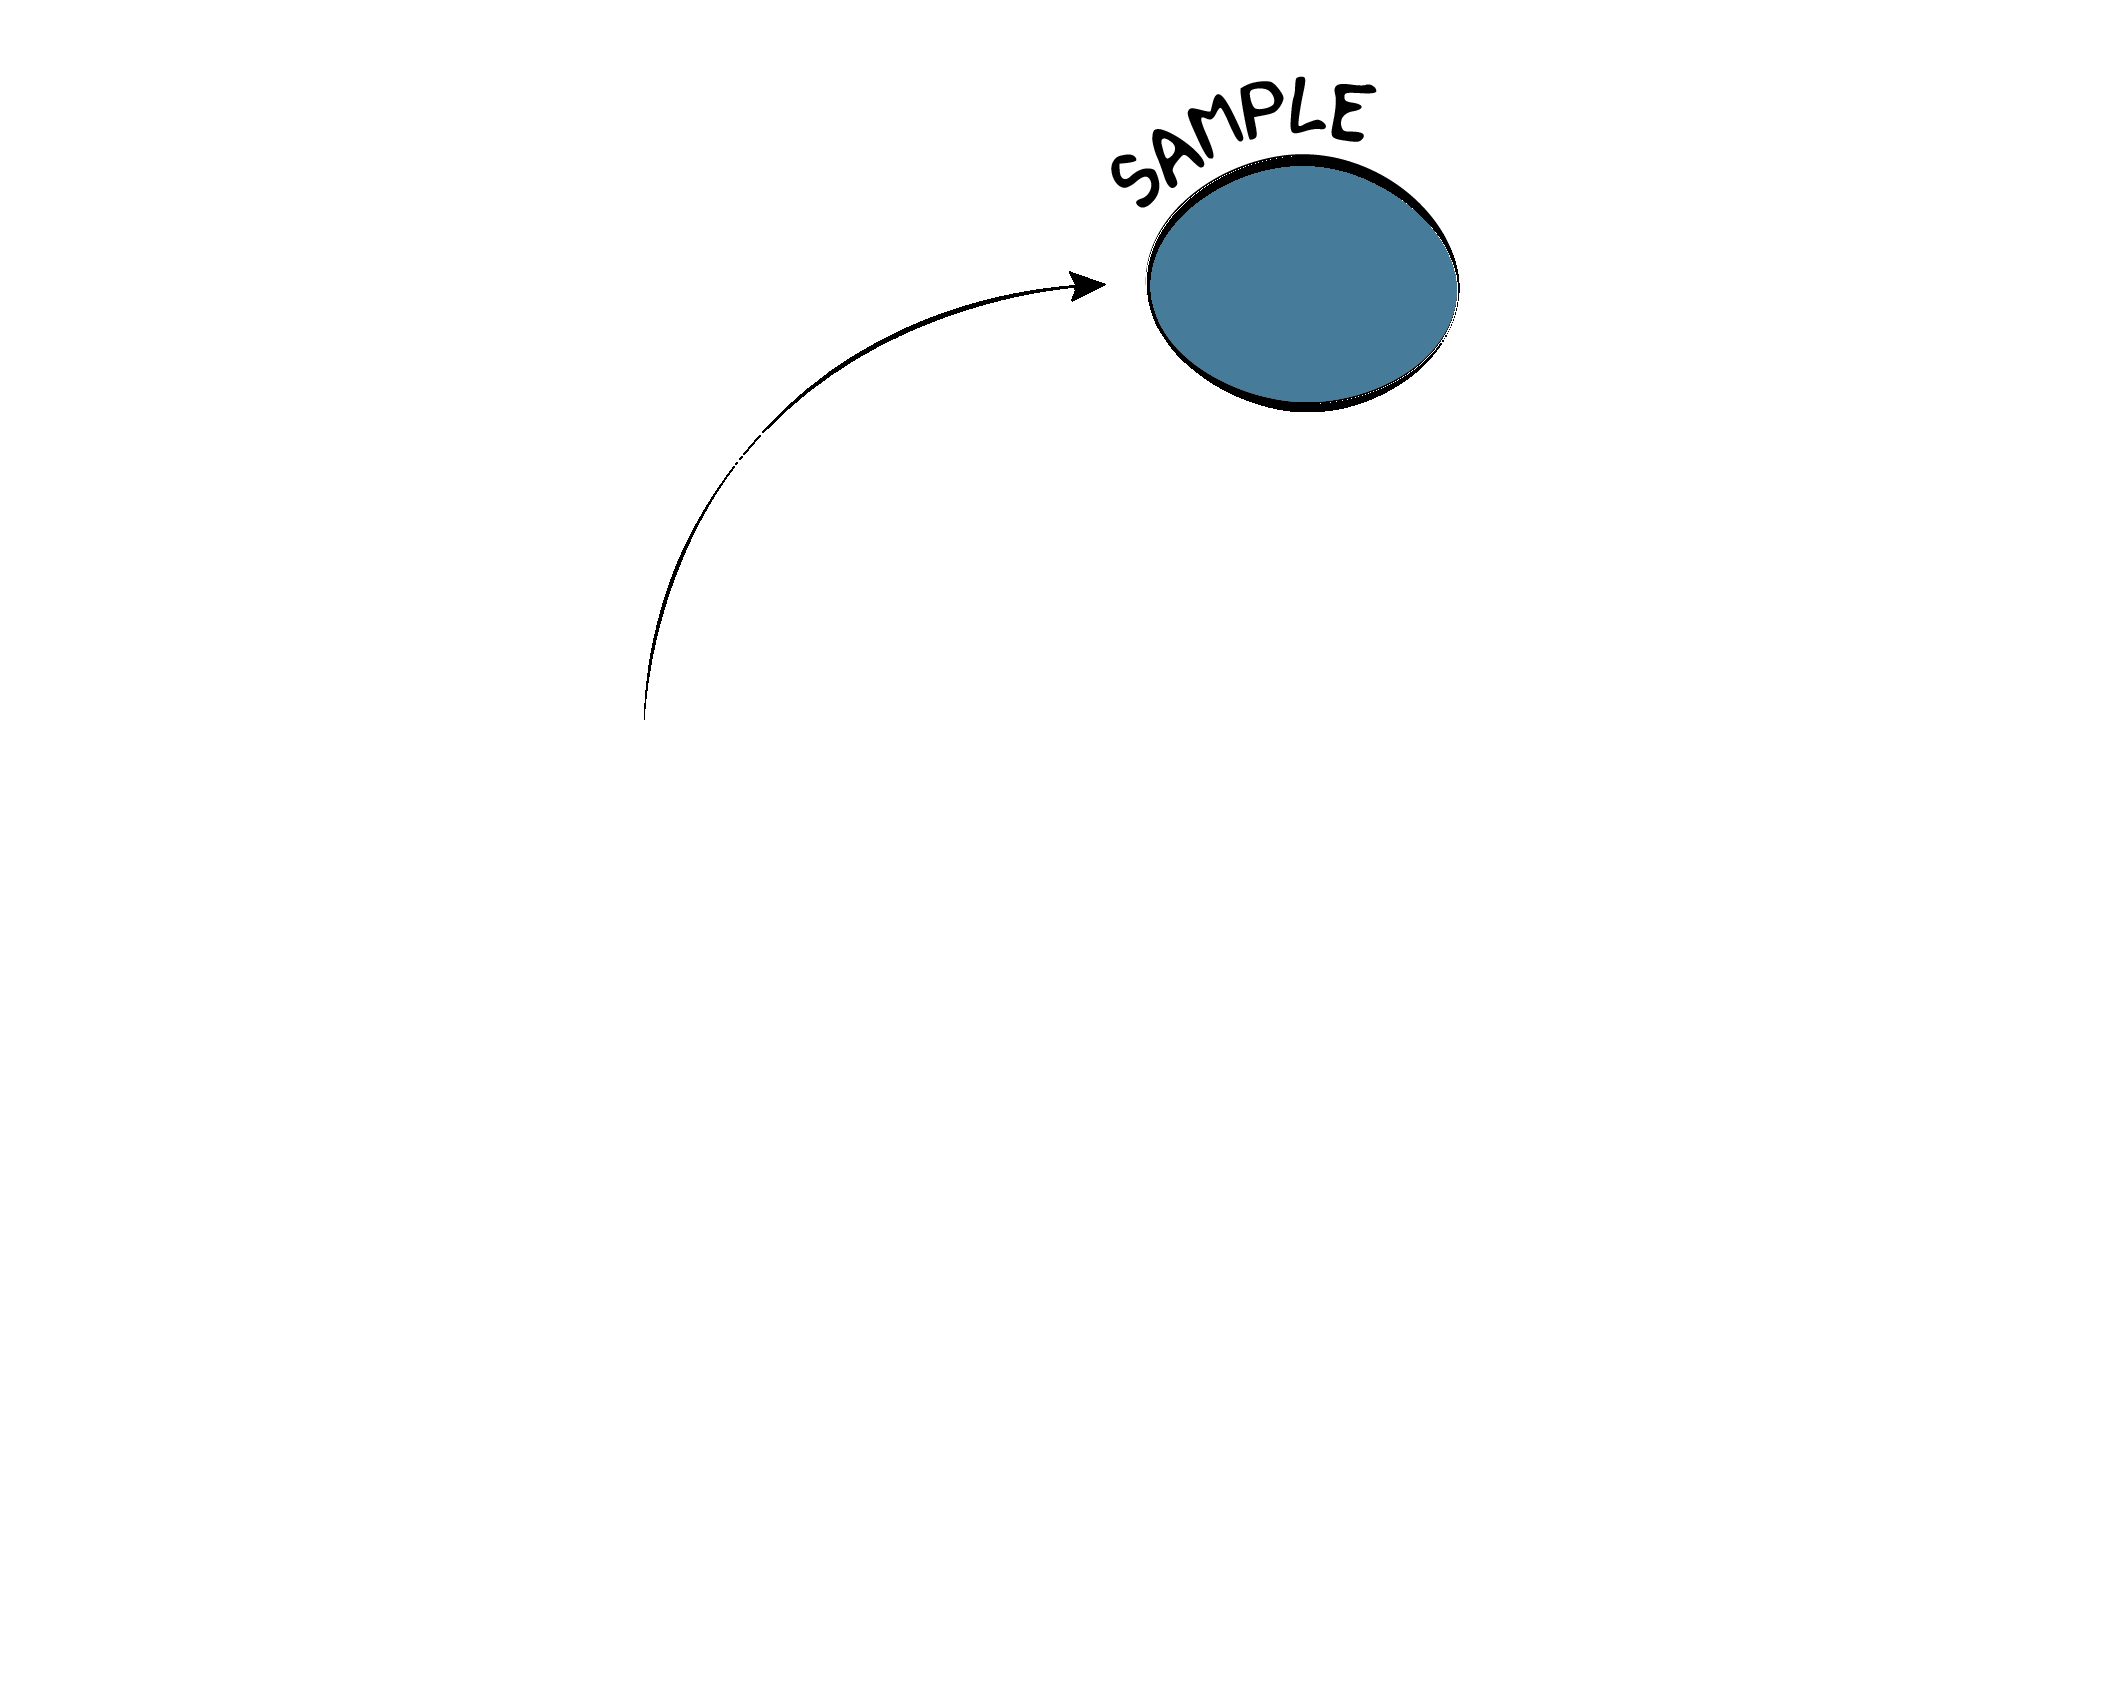
We can never observe the entire population, so we draw a sample.
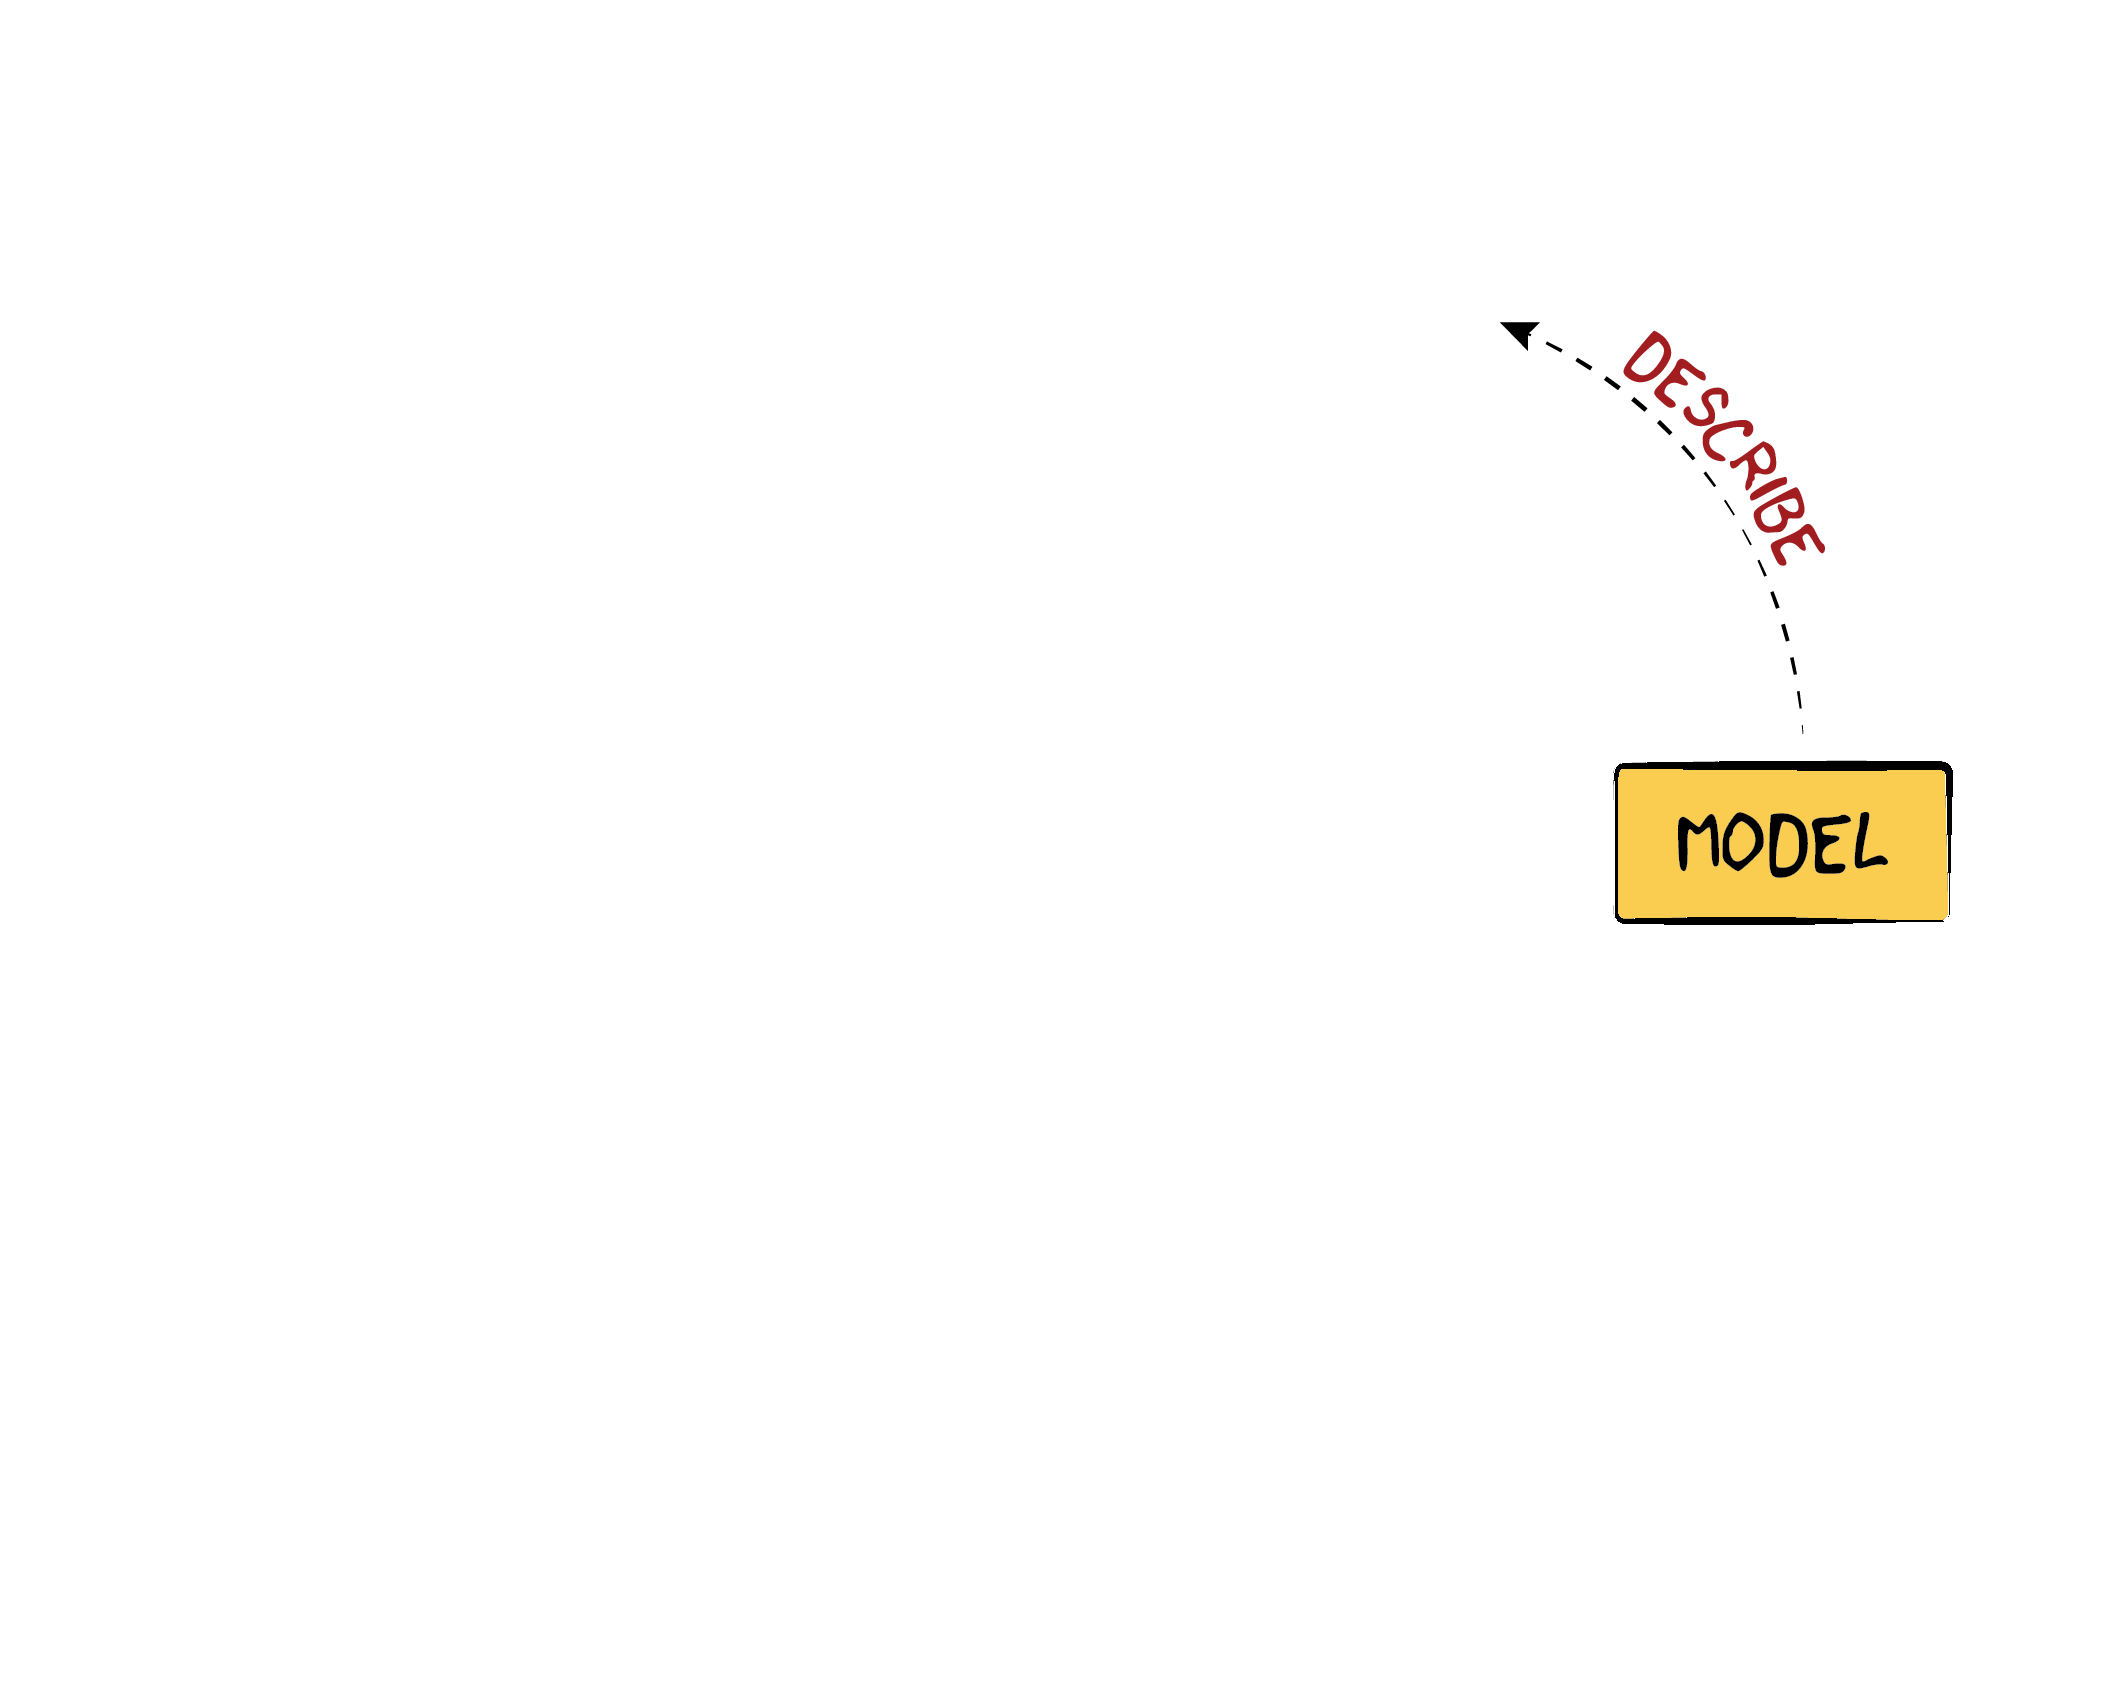
We then use a model to describe the sample.
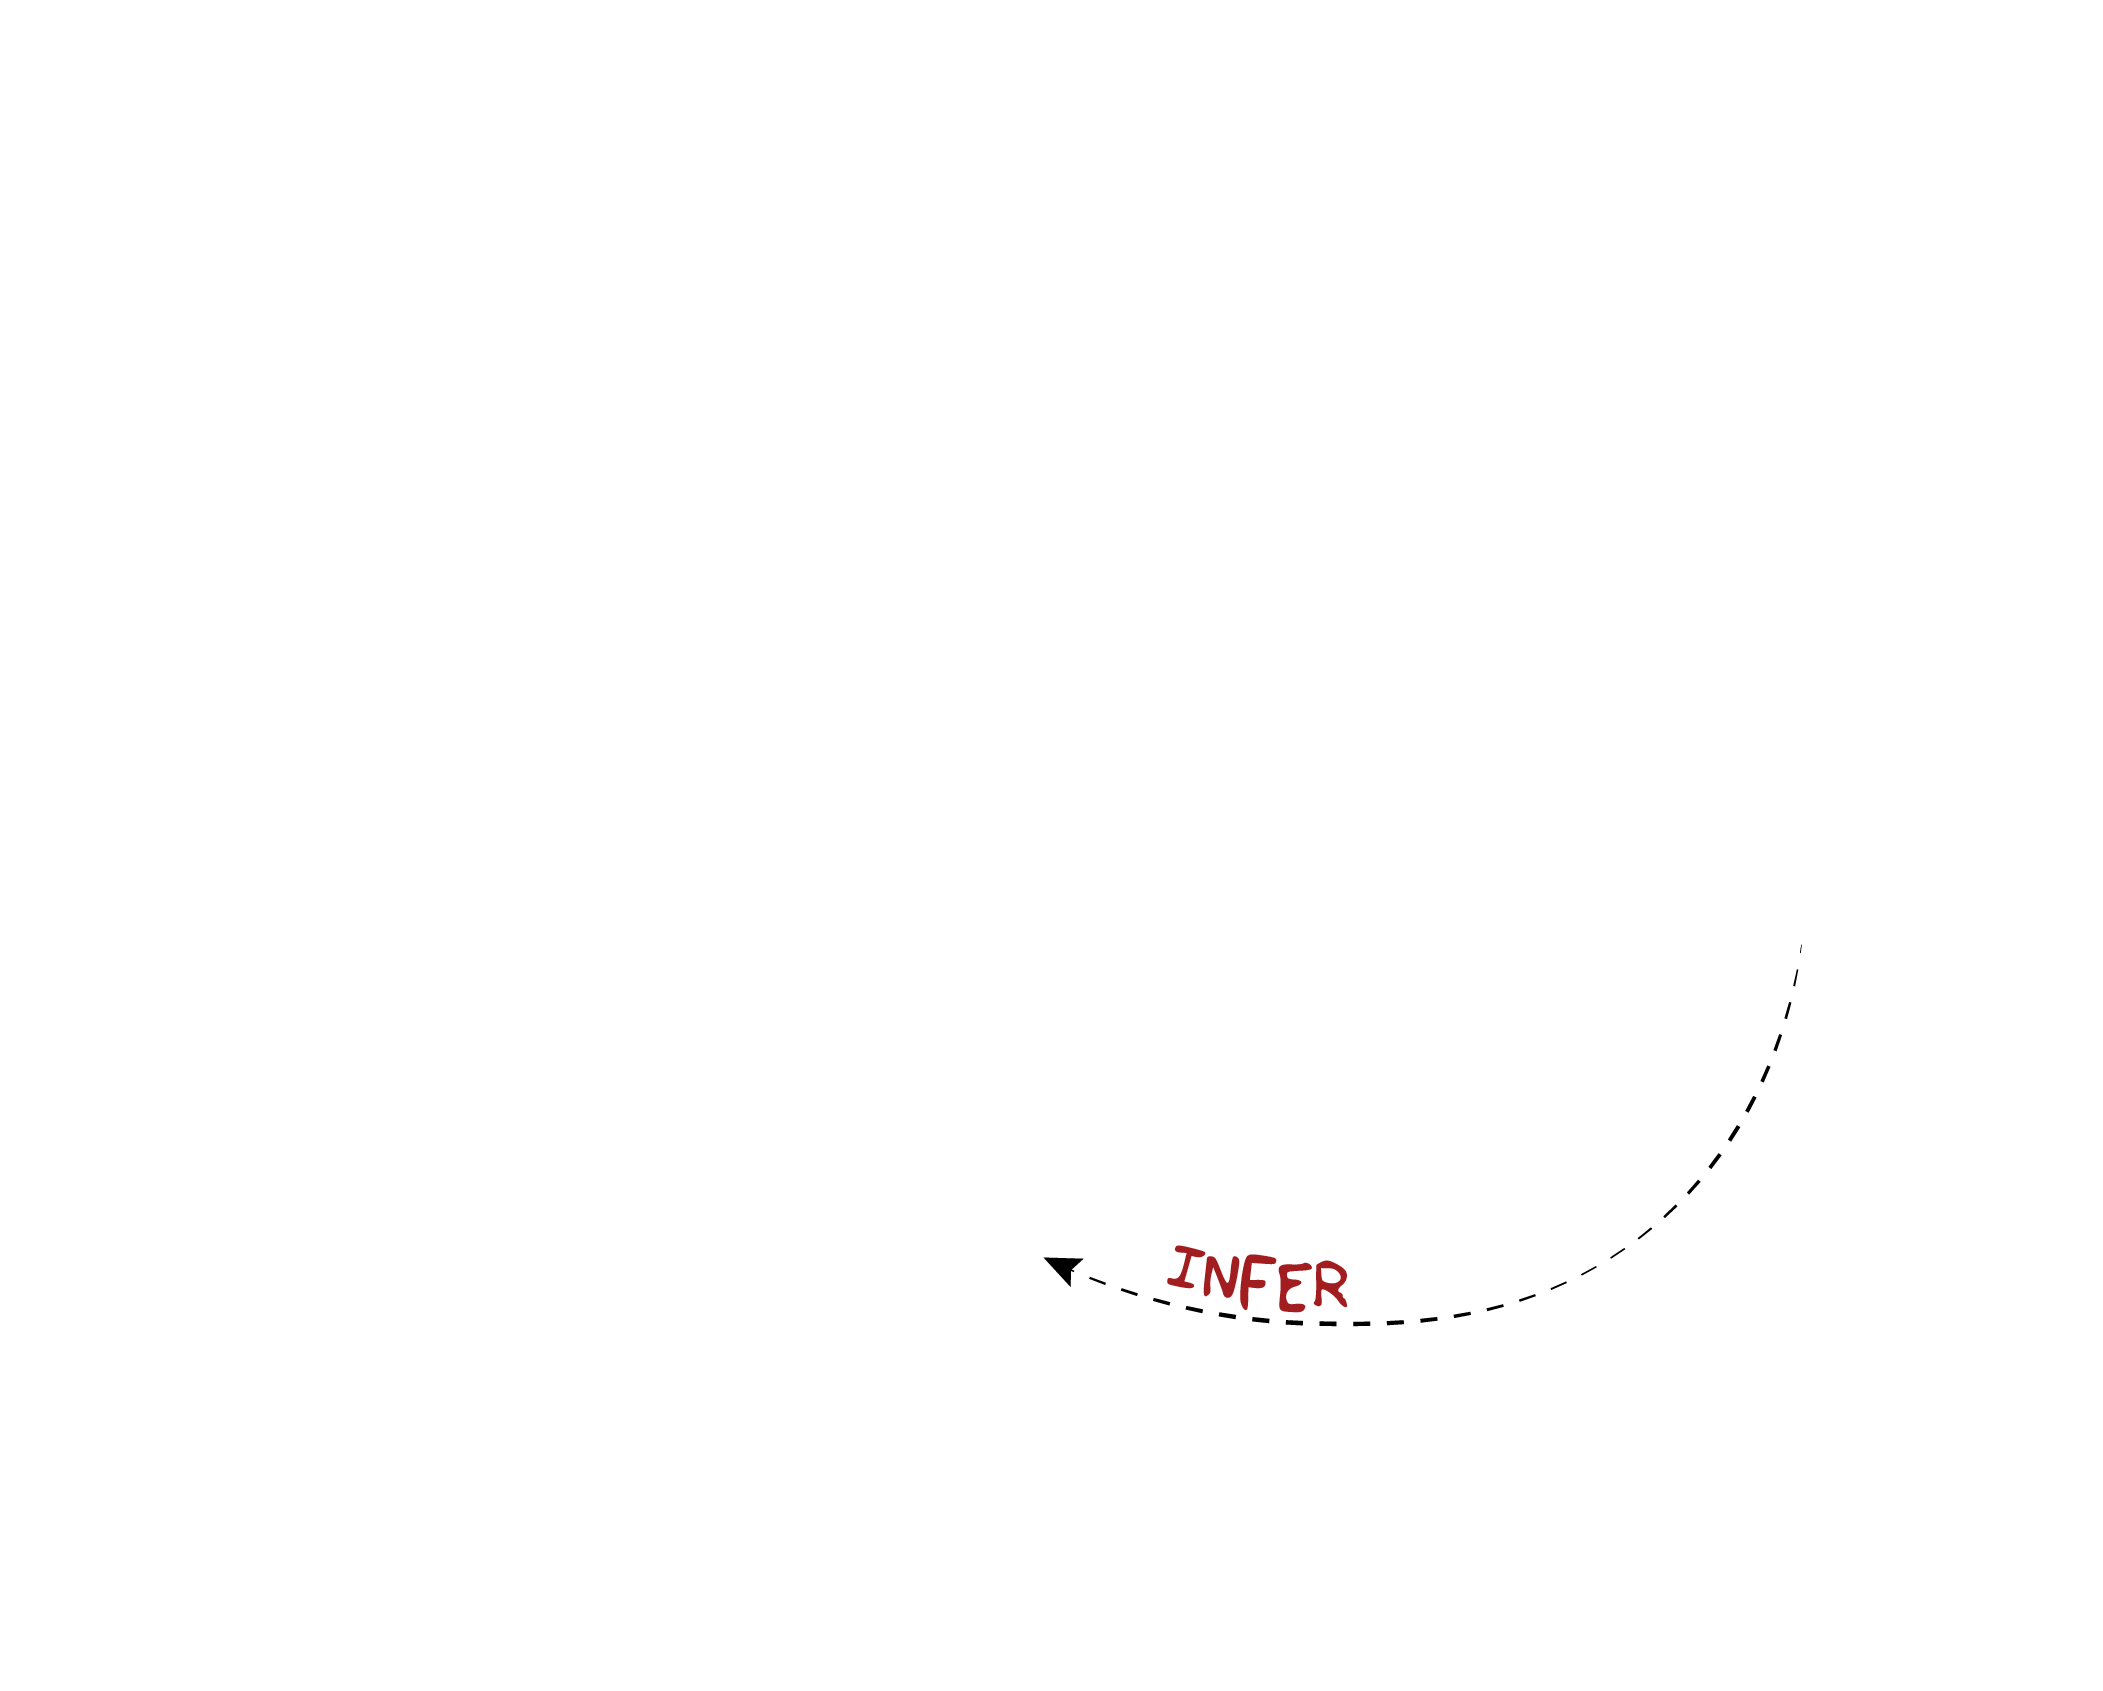
By comparing that model to a null model, we can infer something about the population.
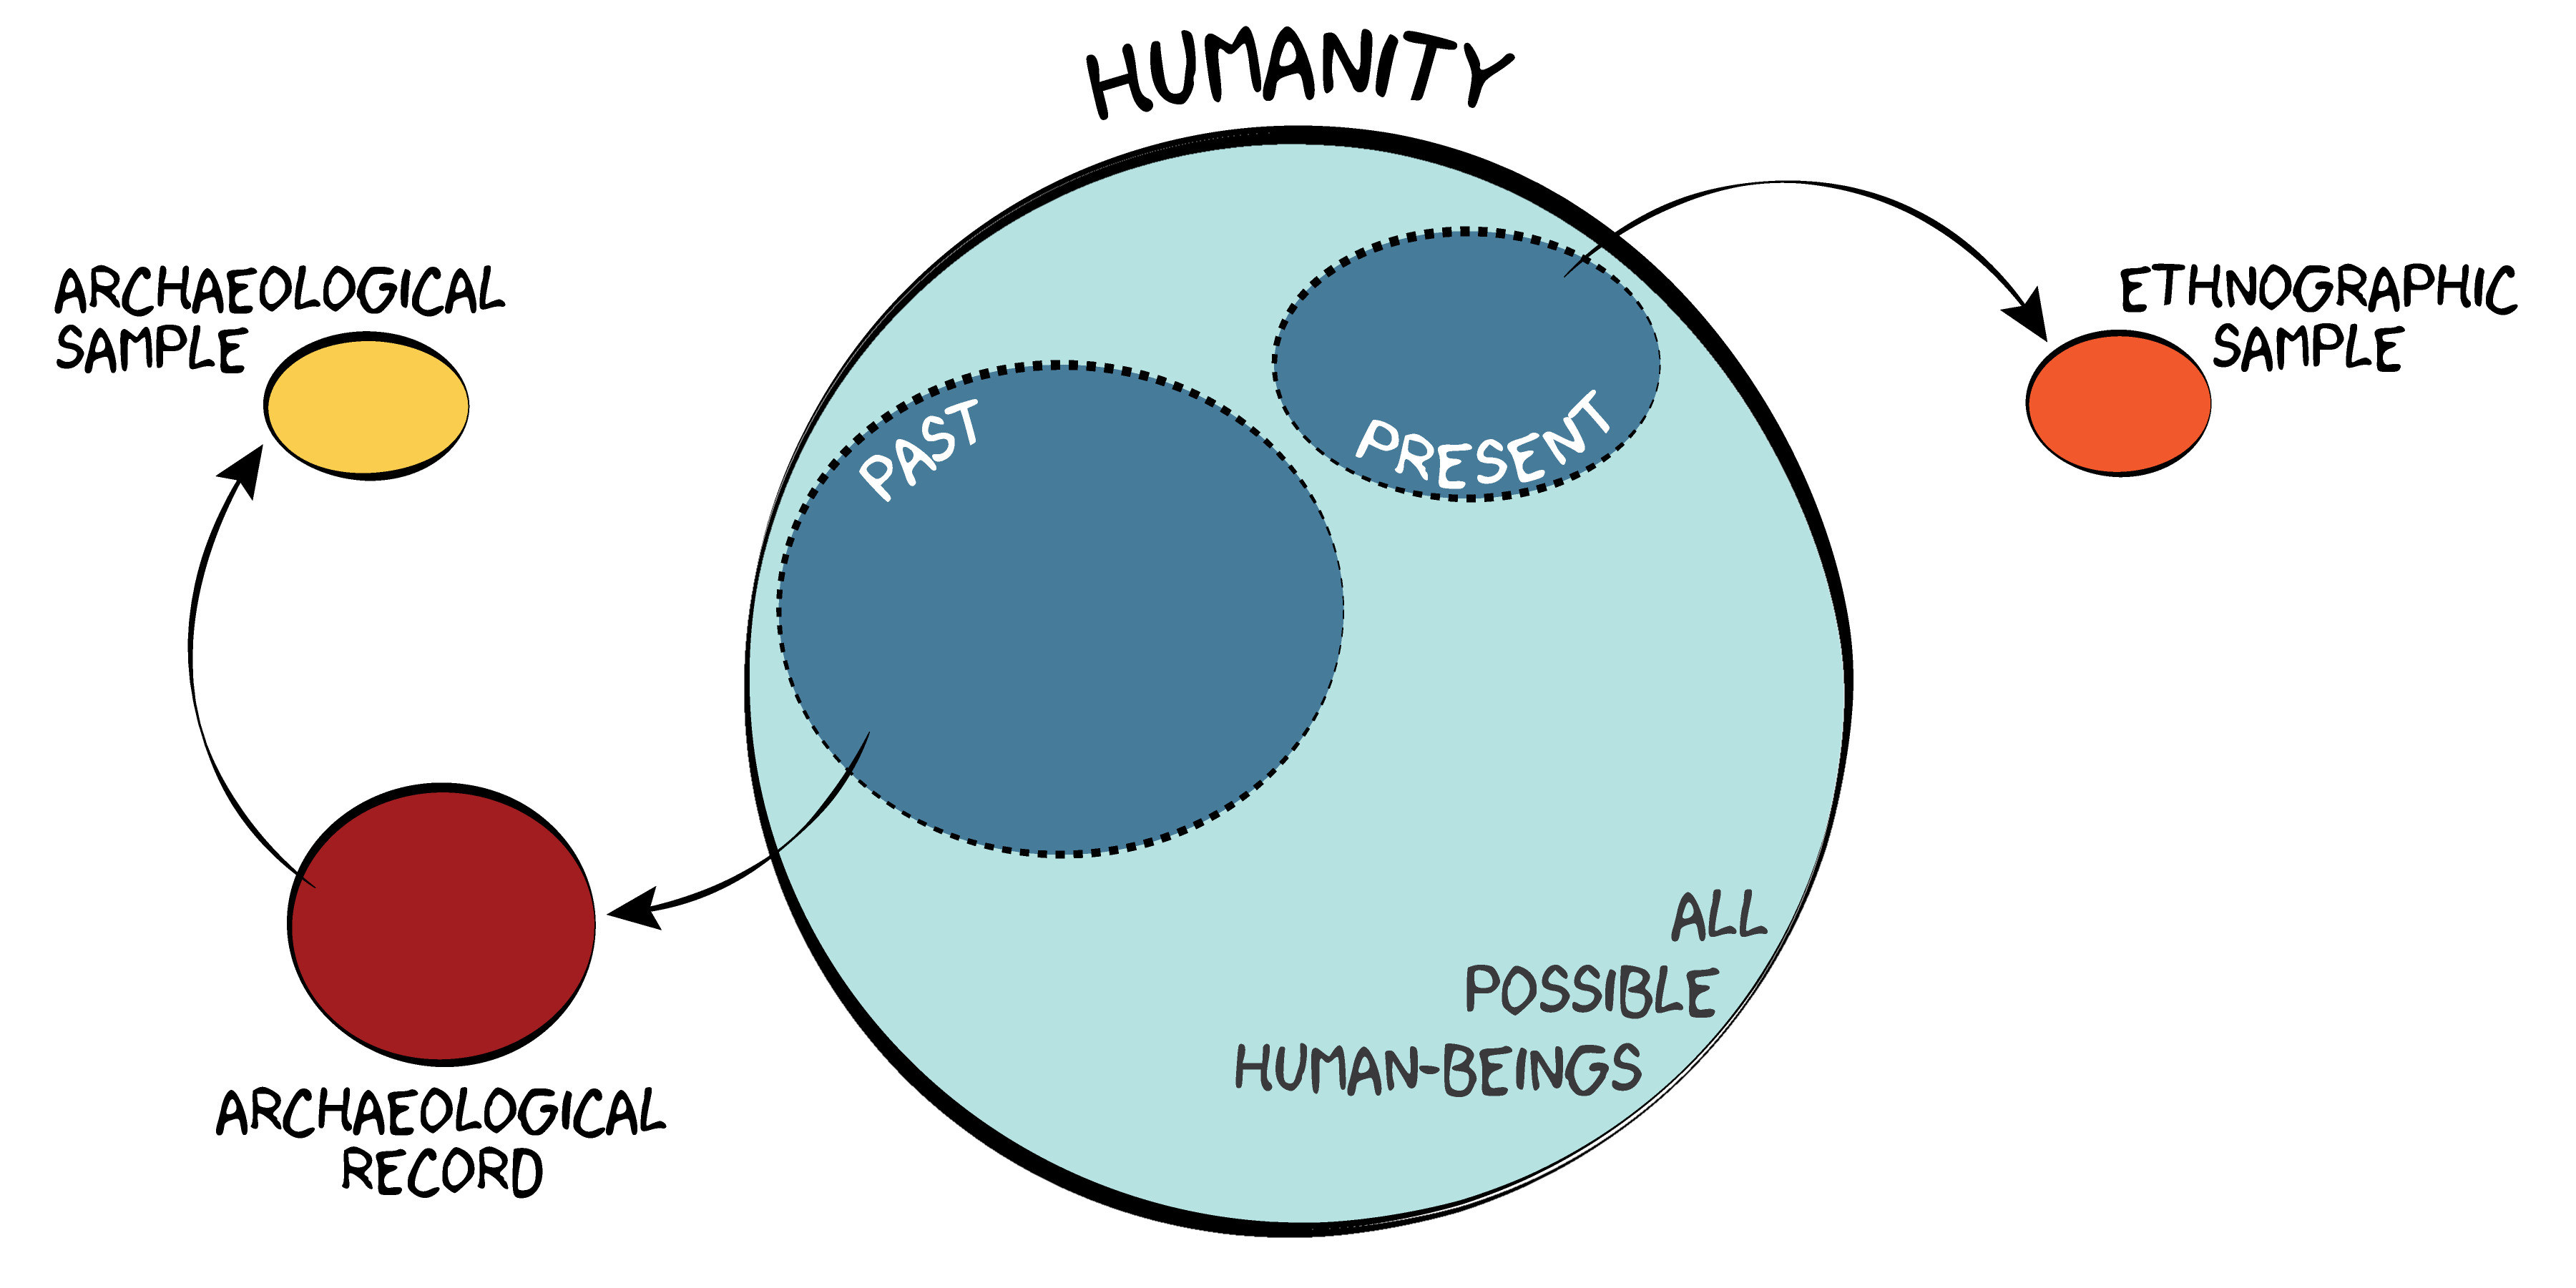
What population does archaeology study?
Why ?
- It’s free!
- It’s transferrable!
- It’s efficient!
- It’s extensible!
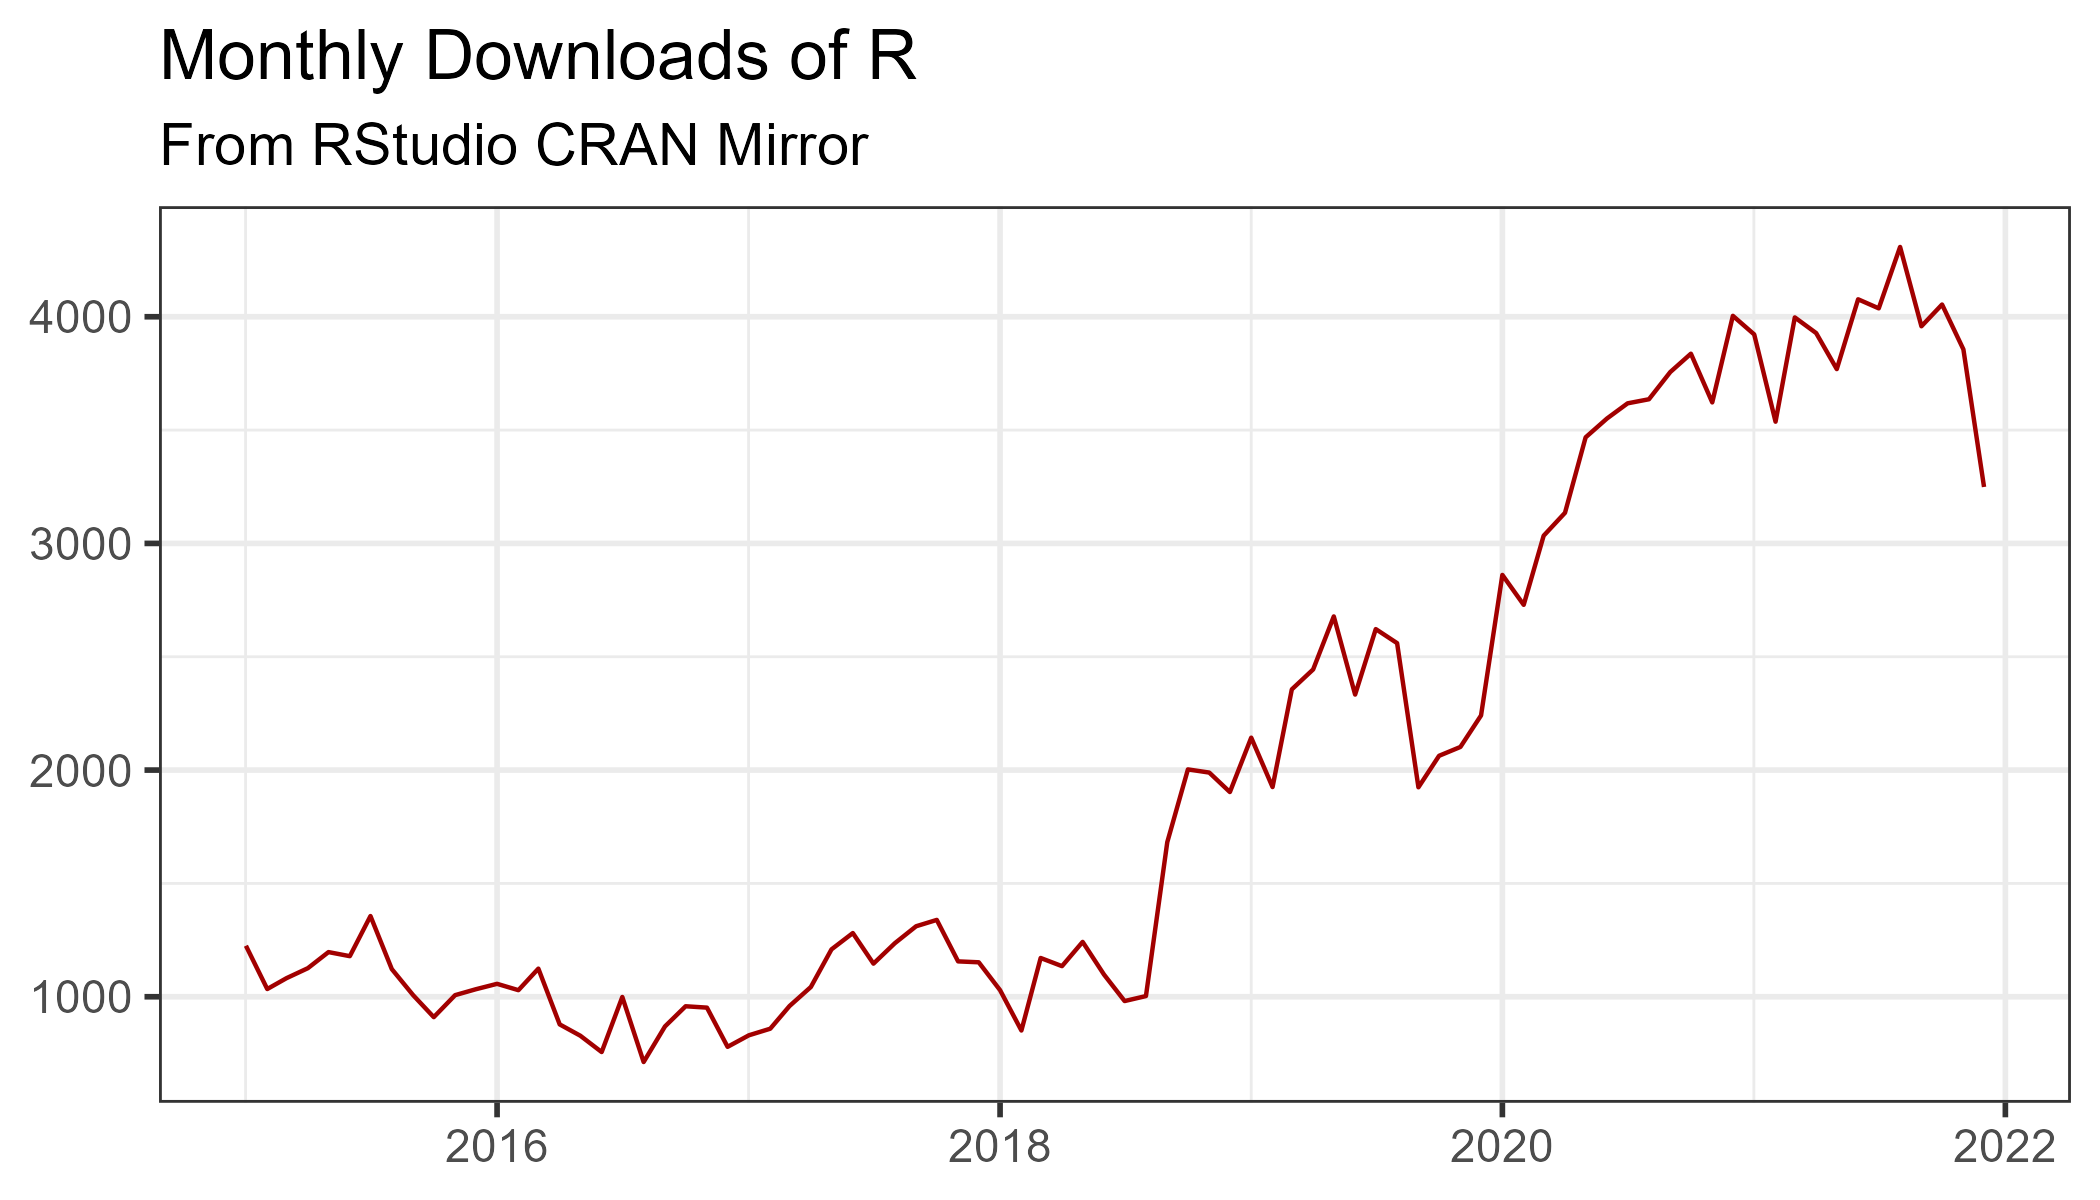
- It’s pretty figures!
- It’s reproducible!
- It’s a community!
R is free software under the terms of the Free Software Foundation’s GNU General Public License.
R will run on any system: Mac OS, Windows, or Linux.
R lets you exploit the awesome computing powers of the modern world. It also provides an elegant and concise syntax for writing complex statistical operations.
R users can write add-on packages that provide additional functionality. Here are a few of my favorites.


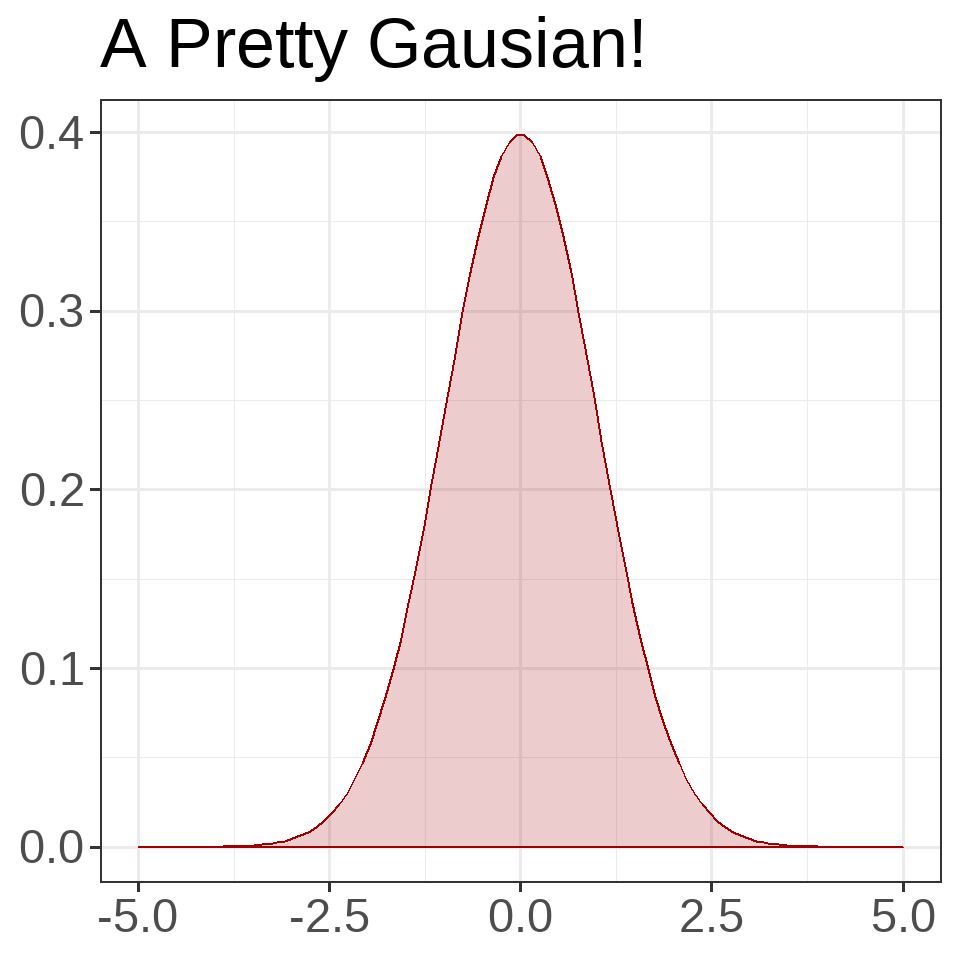
R offers a lot of tools to produce really, really impressive graphics. For example, here is a simple plot of a normal distribution:
R facilitates reproducible research in two ways. First, it forces you to declare explicitly each step in your analysis.
Second, it makes R code shareable. In the simplest case, we use R scripts, but we can also use Quarto, a much more flexible tool for writing, running, and explaining R code.
R is also an incredibly active and growing community.
Quarto = Markdown + R
Quarto allows you to run code and format text in one document.
INPUT
This is an example of Quarto with markdown __syntax__
and __R code__.
```{r}
#| fig-width: 4
#| fig-asp: 1
#| fig-align: center
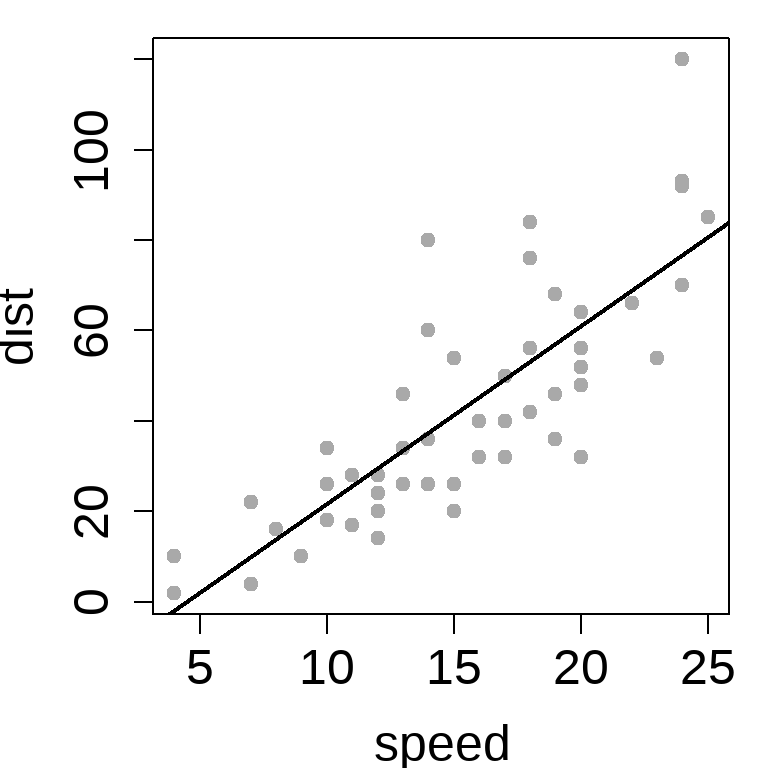
fit <- lm(dist ~ speed, data = cars)
par(pty = "s")
plot(cars, pch = 19, col = 'darkgray')
abline(fit, lwd = 2)
```OUTPUT
This is an example of Quarto with markdown syntax and R code.